Chiropractor Salary in Michigan: $74,644 (2026)
Quick Answer:Across Michigan's 52 metropolitan areas, the average median chiropractor pay sits at $74,644/year heading into 2026 — a figure projected from 2025 BLS OEWS wage data for SOC 29-1011. Because Michigan sits at BEA RPP 93.2 (7% below the U.S. baseline), that statewide median translates to roughly $80,090 in nationally-comparable purchasing power. Highest-paying metros: Wyoming ($78,519), Grand Rapids ($77,560), Clinton Township ($76,321).
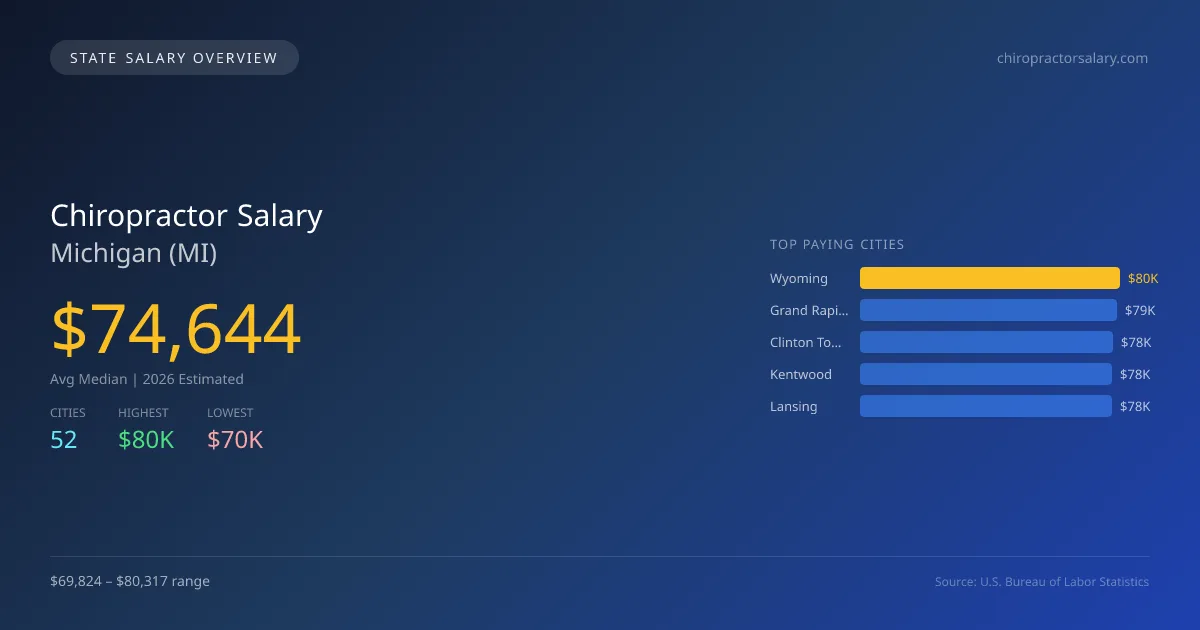
In 2026, the average median salary for chiropractors in Michigan is projected to be $74,644, which is approximately 7.9% lower than the national median of $81,014. Within the state, the highest-paying city for chiropractors is Wyoming at $80,317, while Romulus offers the lowest salary at $69,824. This $10,493 salary gap can be attributed to various factors, including local demand for chiropractic services, population demographics, and the concentration of healthcare facilities. Michigan requires chiropractors to hold a state license, which includes completion of an accredited program and passing national examinations. The scope of practice in Michigan is relatively standard, allowing chiropractors to provide a range of treatment options. The state is projected to experience a 2.29% annual growth rate for chiropractic jobs, indicating steady demand for services. With around 1,369 chiropractors employed statewide, cities like Grand Rapids, Clinton Township, Kentwood, and Lansing also offer competitive salaries, ranging from $77,781 to $79,336. Potential chiropractors should consider these various factors when evaluating the job market and salary expectations in Michigan.
Michigan Chiropractor Salary Range
Overall salary range in Michigan: $41,417 (lowest entry-level) to $265,258 (highest top earner)
Michigan vs National Average
Michigan chiropractors earn 7.86% less than the national median ($-6,370/year difference).
Michigan Chiropractor Salary Distribution (2026)
Chiropractor salaries in Michigan range from $44,640 (entry-level, 10th percentile) to $131,671 (top earners, 90th percentile), with a median of $74,644. The Michigan median is $6,370 below the US national median of $81,014. The average hourly rate is $35.89/hr. Approximately 1,369 chiropractors are employed across 52 cities.
2019 BLS Actual
$63,904
2025 BLS Actual
$72,973
2026 Current Est.
$74,644
2019–2027 Growth
+19.5%
Salary Trajectory for Chiropractors in Michigan (2019–2027)
2019–2025: actual BLS OEWS data for this metro area. 2026+: CAGR 2.29% projection.
| Year | Annual Salary | Status |
|---|---|---|
| 2019 | $63,904 | Actual |
| 2020 | $62,524 | Actual |
| 2021 | $65,132 | Actual |
| 2022 | $75,681 | Actual |
| 2023 | $88,726 | Actual |
| 2024 | $80,558 | Actual |
| 2025 | $72,973 | Actual |
| 2026(current) | $74,644 | Estimated |
| 2027 | $76,353 | Projected |
Based on 7 years of BLS OEWS data for the Michigan metropolitan area, the median chiropractor salary grew 14.2% from $63,904 (2019) to $72,973 (2025). At a 2.29% compound annual growth rate, salaries are projected to reach $76,353 by 2027 — a total increase of $12,449 (19.48%) from 2019.
Note: Historical values (2019–2025) are actual BLS OEWS figures for the Michigan metropolitan area, sourced from annual Occupational Employment and Wage Statistics surveys. 2026–2026 figures are current estimates, and 2027 values are projections, calculated using a 2.29% CAGR derived from 7-year BLS historical data. Actual salaries may vary based on employer, experience, certifications, and local market conditions.
Top 5 Highest Paying Cities in Michigan
Lowest Paying Cities in Michigan
| City | Median Salary |
|---|---|
| Romulus | $69,824 |
| Ypsilanti | $70,227 |
| Mount Pleasant | $70,432 |
| Portage | $71,409 |
| Traverse City | $71,454 |
Best Value Cities for Chiropractors in Michigan
When adjusted for local cost of living, these Michigan cities offer the most purchasing power for chiropractors.
| City | Nominal Salary | CoL Index | Adjusted Salary |
|---|---|---|---|
| Wyoming | $80,317 | 93.2 | $86,177 |
| Clinton Township | $78,069 | 93.2 | $83,765 |
| Kentwood | $77,931 | 93.2 | $83,617 |
| Grand Rapids | $79,336 | 95.546 | $83,034 |
| East Lansing | $77,125 | 93.2 | $82,752 |
Adjusted salary = nominal salary × (100 / CoL index). CoL index: 100 = national average. Lower index = lower cost of living.
Salary by Experience Level in Michigan
| Experience Level | Estimated Annual |
|---|---|
| Entry Level (0-2 years) | $44,640 |
| Mid Career (3-7 years) | $74,644 |
| Experienced (7+ years) | $131,671 |
Estimates based on BLS percentile data averaged across Michigan metro areas. Individual pay varies by employer, certifications, and specialization.
All 52 Cities in Michigan
| # | City | Median Salary |
|---|---|---|
| 1 | Wyoming | $80,317 |
| 2 | Grand Rapids | $79,336 |
| 3 | Clinton Township | $78,069 |
| 4 | Kentwood | $77,931 |
| 5 | Lansing | $77,781 |
| 6 | East Lansing | $77,125 |
| 7 | Sterling Heights | $77,086 |
| 8 | Battle Creek | $76,427 |
| 9 | West Bloomfield | $76,307 |
| 10 | Kalamazoo | $76,283 |
| 11 | Shelby Township | $76,133 |
| 12 | Troy | $75,972 |
| 13 | Ann Arbor | $75,858 |
| 14 | Westland | $75,774 |
| 15 | Farmington Hills | $75,614 |
| 16 | Dearborn Heights | $75,446 |
| 17 | Southfield | $75,303 |
| 18 | Macomb Township | $75,141 |
| 19 | St. Clair Shores | $75,057 |
| 20 | Rochester Hills | $75,015 |
| 21 | Bay City | $74,953 |
| 22 | Taylor | $74,806 |
| 23 | Port Huron | $74,596 |
| 24 | Royal Oak | $74,579 |
| 25 | Lincoln Park | $74,525 |
| 26 | Jackson | $74,461 |
| 27 | Saginaw | $74,408 |
| 28 | Livonia | $74,375 |
| 29 | Canton | $73,820 |
| 30 | Novi | $73,795 |
| 31 | Auburn Hills | $73,722 |
| 32 | Waterford | $73,682 |
| 33 | Muskegon | $73,587 |
| 34 | Roseville | $73,547 |
| 35 | Flint | $73,503 |
| 36 | Garden City | $73,401 |
| 37 | Allen Park | $72,961 |
| 38 | Pontiac | $72,910 |
| 39 | Detroit | $72,851 |
| 40 | Marquette | $72,720 |
| 41 | Norton Shores | $72,703 |
| 42 | Inkster | $72,606 |
| 43 | Dearborn | $72,476 |
| 44 | Warren | $72,219 |
| 45 | Midland | $72,182 |
| 46 | Holland | $72,152 |
| 47 | Ferndale | $71,652 |
| 48 | Traverse City | $71,454 |
| 49 | Portage | $71,409 |
| 50 | Mount Pleasant | $70,432 |
| 51 | Ypsilanti | $70,227 |
| 52 | Romulus | $69,824 |
More Michigan Salary Data
Hourly Rates
Explore chiropractor hourly pay in Michigan cities.
Senior / Experienced
Top earner salaries for experienced chiropractors.
Compare Cities in Michigan
View all comparisons →Explore More Chiropractor Salary Data
Frequently Asked Questions
How much do chiropractors make in Michigan in 2026?
What is the highest paying city for chiropractors in Michigan?
How does Michigan chiropractor pay compare to the national average?
What is the entry-level chiropractor salary in Michigan?
How many chiropractors are employed in Michigan?
Which Michigan city offers the best value for chiropractors?
Written by Maria Gonzalez, D.C.
Career Analyst
Maria has 10 years of experience as a chiropractor. She specializes in sports injuries and practices in a private clinic. Maria also conducts workshops for community health education.
Methodology & Data Source
Statewide salary figures on this page are 2026 projections based on the Bureau of Labor Statistics Occupational Employment and Wage Statistics (OEWS) survey, May 2026 release. A 2.29% compound annual growth rate (CAGR), derived from 6-year national BLS wage trends, was applied to each metro area's reported salary to estimate current 2026 chiropractor compensation across Michigan. State averages are employment-weighted across 52 metro areas — larger metro areas with more chiropractorscontribute proportionally more to the average, producing figures that better reflect typical compensation. Individual pay varies by city, employer, certifications, and experience.
Data Sources & Methodology
Source: BLS, OEWS, 7-year dataset (–). Per-city data from annual BLS metropolitan area surveys.
2026 figures are projected from 2025 BLS data using a compound annual growth rate (CAGR) of 2.29%, derived from historical BLS wage trends for chiropractors (SOC 29-1011).
Compiled and verified by Maria Gonzalez, D.C., a licensed chiropractor with 10+ years of clinical experience. · View source data at BLS.gov