Chiropractor Salary in New Jersey: $103,792 (2026)
Quick Answer:Across New Jersey's 61 metropolitan areas, the average median chiropractor pay sits at $103,792/year heading into 2026 — a figure projected from 2025 BLS OEWS wage data for SOC 29-1011. Because New Jersey sits at BEA RPP 115.2 (15% above the U.S. baseline), that statewide median translates to roughly $90,097 in nationally-comparable purchasing power. Highest-paying metros: Jersey City ($133,116), Newark ($131,064), East Orange ($100,468).
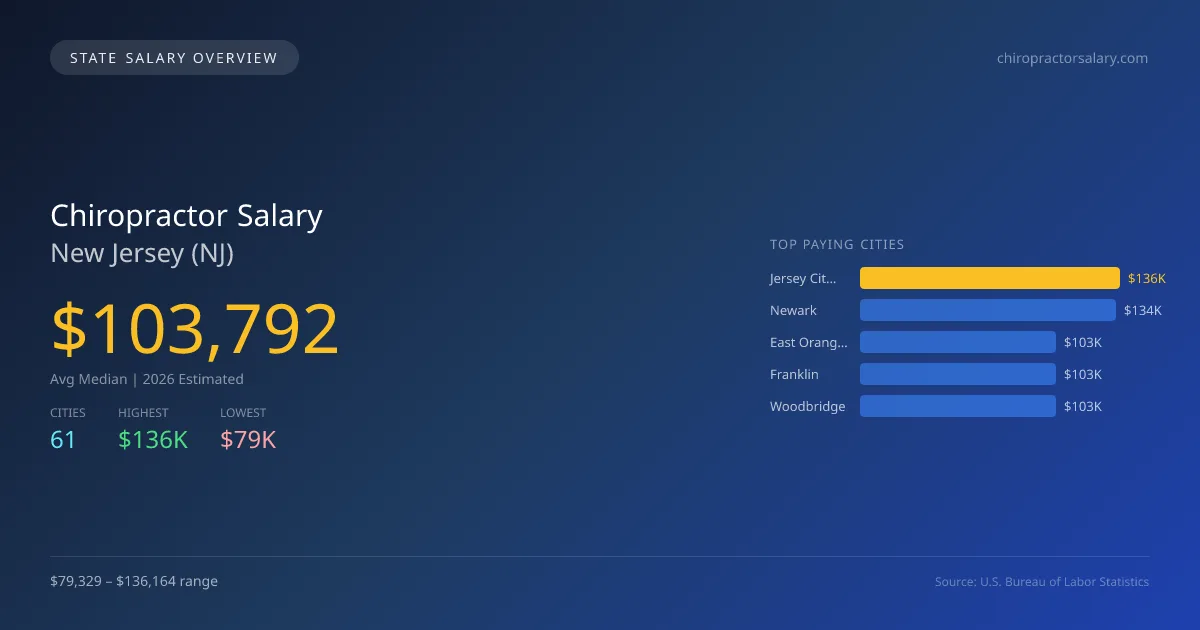
In 2026, the average median salary for chiropractors in New Jersey is projected to be $103,792, significantly higher than the national median of $81,014, reflecting a difference of +28.1%. The highest-paying city in the state is Jersey City, offering an average salary of $136,164, while Camden has the lowest at $79,329, creating a salary gap of $56,835. This disparity can be attributed to varying factors such as cost of living, local demand for chiropractic services, and the concentration of healthcare facilities. New Jersey's regulations include state licensing requirements and defined scope of practice laws that can affect earnings potential. With 841 chiropractors employed in the state, the job market is projected to grow at an annual CAGR of 2.29%, indicating steady demand in the profession. Other cities like Newark ($134,065), East Orange ($102,769), Franklin ($102,769), and Woodbridge ($102,739) also reflect competitive salary ranges but are influenced by local market conditions and practitioner experience. Overall, the outlook for chiropractors in New Jersey remains positive, supported by an increasing awareness of holistic health practices and preventive care within the healthcare community.
New Jersey Chiropractor Salary Range
Overall salary range in New Jersey: $46,011 (lowest entry-level) to $211,055 (highest top earner)
New Jersey vs National Average
New Jersey chiropractors earn 28.12% more than the national median (+$22,778/year difference).
New Jersey Chiropractor Salary Distribution (2026)
Chiropractor salaries in New Jersey range from $60,375 (entry-level, 10th percentile) to $160,877 (top earners, 90th percentile), with a median of $103,792. The New Jersey median is $22,778 above the US national median of $81,014. The average hourly rate is $49.90/hr. Approximately 841 chiropractors are employed across 61 cities.
2019 BLS Actual
$96,320
2025 BLS Actual
$101,468
2026 Current Est.
$103,792
2019–2027 Growth
+10.2%
Salary Trajectory for Chiropractors in New Jersey (2019–2027)
2019–2025: actual BLS OEWS data for this metro area. 2026+: CAGR 2.29% projection.
| Year | Annual Salary | Status |
|---|---|---|
| 2019 | $96,320 | Actual |
| 2020 | $79,310 | Actual |
| 2021 | $77,730 | Actual |
| 2022 | $99,220 | Actual |
| 2023 | $98,048 | Actual |
| 2024 | $109,815 | Actual |
| 2025 | $101,468 | Actual |
| 2026(current) | $103,792 | Estimated |
| 2027 | $106,169 | Projected |
Based on 7 years of BLS OEWS data for the New Jersey metropolitan area, the median chiropractor salary grew 5.3% from $96,320 (2019) to $101,468 (2025). At a 2.29% compound annual growth rate, salaries are projected to reach $106,169 by 2027 — a total increase of $9,849 (10.23%) from 2019.
Note: Historical values (2019–2025) are actual BLS OEWS figures for the New Jersey metropolitan area, sourced from annual Occupational Employment and Wage Statistics surveys. 2026–2026 figures are current estimates, and 2027 values are projections, calculated using a 2.29% CAGR derived from 7-year BLS historical data. Actual salaries may vary based on employer, experience, certifications, and local market conditions.
Top 5 Highest Paying Cities in New Jersey
Lowest Paying Cities in New Jersey
| City | Median Salary |
|---|---|
| Camden | $79,329 |
| Summit | $94,468 |
| Rahway | $95,894 |
| Evesham | $96,318 |
| Egg Harbor | $96,460 |
Best Value Cities for Chiropractors in New Jersey
When adjusted for local cost of living, these New Jersey cities offer the most purchasing power for chiropractors.
| City | Nominal Salary | CoL Index | Adjusted Salary |
|---|---|---|---|
| Jersey City | $136,164 | 115.2 | $118,198 |
| Newark | $134,065 | 115.2 | $116,376 |
| East Orange | $102,769 | 115.2 | $89,209 |
| Franklin | $102,769 | 115.2 | $89,209 |
| Woodbridge | $102,739 | 115.2 | $89,183 |
Adjusted salary = nominal salary × (100 / CoL index). CoL index: 100 = national average. Lower index = lower cost of living.
Salary by Experience Level in New Jersey
| Experience Level | Estimated Annual |
|---|---|
| Entry Level (0-2 years) | $60,375 |
| Mid Career (3-7 years) | $103,792 |
| Experienced (7+ years) | $160,877 |
Estimates based on BLS percentile data averaged across New Jersey metro areas. Individual pay varies by employer, certifications, and specialization.
All 61 Cities in New Jersey
| # | City | Median Salary |
|---|---|---|
| 1 | Jersey City | $136,164 |
| 2 | Newark | $134,065 |
| 3 | East Orange | $102,769 |
| 4 | Franklin | $102,769 |
| 5 | Woodbridge | $102,739 |
| 6 | Parsippany-Troy Hills | $102,592 |
| 7 | Union | $102,335 |
| 8 | Elizabeth | $102,297 |
| 9 | Brick | $102,085 |
| 10 | Gloucester Township | $101,797 |
| 11 | New Brunswick | $101,757 |
| 12 | Vineland | $101,588 |
| 13 | Howell | $101,420 |
| 14 | Paterson | $101,298 |
| 15 | Plainfield | $101,178 |
| 16 | Irvington | $101,026 |
| 17 | West New York | $100,873 |
| 18 | Piscataway | $100,802 |
| 19 | Jackson | $100,745 |
| 20 | Lakewood | $100,577 |
| 21 | West Orange | $100,519 |
| 22 | Montclair | $100,370 |
| 23 | Princeton | $100,283 |
| 24 | Washington Township | $100,212 |
| 25 | Old Bridge | $100,175 |
| 26 | Edison | $100,020 |
| 27 | Union City | $99,974 |
| 28 | Toms River | $99,942 |
| 29 | Bridgewater | $99,827 |
| 30 | Middletown | $99,798 |
| 31 | Trenton | $99,669 |
| 32 | Clifton | $99,492 |
| 33 | South Brunswick | $99,315 |
| 34 | Berkeley | $99,307 |
| 35 | Perth Amboy | $99,292 |
| 36 | Wayne | $99,260 |
| 37 | Linden | $99,245 |
| 38 | Passaic | $99,219 |
| 39 | East Brunswick | $99,181 |
| 40 | Bloomfield | $98,971 |
| 41 | Long Branch | $98,906 |
| 42 | Westfield | $98,631 |
| 43 | Hamilton | $98,529 |
| 44 | Sayreville | $98,497 |
| 45 | Cherry Hill | $98,481 |
| 46 | North Bergen | $98,305 |
| 47 | Hoboken | $98,216 |
| 48 | Kearny | $98,064 |
| 49 | Manalapan | $97,978 |
| 50 | Bayonne | $97,879 |
| 51 | Atlantic City | $97,868 |
| 52 | Manchester | $97,655 |
| 53 | Moorestown | $97,273 |
| 54 | Hackensack | $97,271 |
| 55 | Marlboro | $96,767 |
| 56 | Mount Laurel | $96,696 |
| 57 | Egg Harbor | $96,460 |
| 58 | Evesham | $96,318 |
| 59 | Rahway | $95,894 |
| 60 | Summit | $94,468 |
| 61 | Camden | $79,329 |
More New Jersey Salary Data
Senior / Experienced
Top earner salaries for experienced chiropractors.
Explore More Chiropractor Salary Data
Frequently Asked Questions
How much do chiropractors make in New Jersey in 2026?
What is the highest paying city for chiropractors in New Jersey?
How does New Jersey chiropractor pay compare to the national average?
What is the entry-level chiropractor salary in New Jersey?
How many chiropractors are employed in New Jersey?
Which New Jersey city offers the best value for chiropractors?
Written by Maria Gonzalez, D.C.
Career Analyst
Maria has 10 years of experience as a chiropractor. She specializes in sports injuries and practices in a private clinic. Maria also conducts workshops for community health education.
Methodology & Data Source
Statewide salary figures on this page are 2026 projections based on the Bureau of Labor Statistics Occupational Employment and Wage Statistics (OEWS) survey, May 2026 release. A 2.29% compound annual growth rate (CAGR), derived from 6-year national BLS wage trends, was applied to each metro area's reported salary to estimate current 2026 chiropractor compensation across New Jersey. State averages are employment-weighted across 61 metro areas — larger metro areas with more chiropractorscontribute proportionally more to the average, producing figures that better reflect typical compensation. Individual pay varies by city, employer, certifications, and experience.
Data Sources & Methodology
Source: BLS, OEWS, 6-year dataset (–). Per-city data from annual BLS metropolitan area surveys.
2026 figures are projected from 2025 BLS data using a compound annual growth rate (CAGR) of 2.29%, derived from historical BLS wage trends for chiropractors (SOC 29-1011).
Compiled and verified by Maria Gonzalez, D.C., a licensed chiropractor with 10+ years of clinical experience. · View source data at BLS.gov