Chiropractor Salary in Tennessee: $82,676 (2026)
Quick Answer:Across Tennessee's 30 metropolitan areas, the average median chiropractor pay sits at $82,676/year heading into 2026 — a figure projected from 2025 BLS OEWS wage data for SOC 29-1011. Because Tennessee sits at BEA RPP 91.8 (8% below the U.S. baseline), that statewide median translates to roughly $90,061 in nationally-comparable purchasing power. Highest-paying metros: Nashville ($90,460), Franklin ($89,371), Murfreesboro ($88,857).
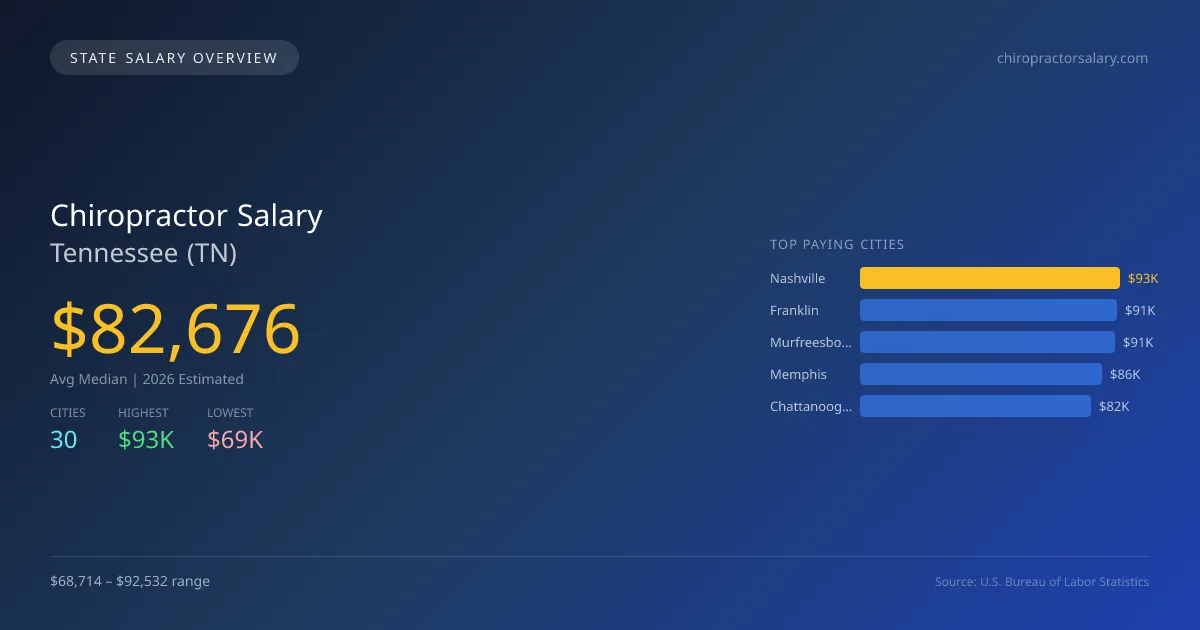
In Tennessee, the average median salary for chiropractors in 2026 is projected to be $82,676, surpassing the national median of $81,014 by 2.1%. The highest earnings can be found in Nashville, where chiropractors are anticipated to make $92,532, while those in Tullahoma can expect around $68,714, highlighting a significant salary gap of $23,818. This difference is driven by various factors, including the density of healthcare facilities, population demographics, and the general cost of living in these areas. Tennessee requires chiropractors to obtain a state license, which involves completing a Doctor of Chiropractic degree and passing national and state exams. The state's scope of practice laws allow for a wide range of services, contributing to the growing demand for chiropractic care. Projections indicate a 2.29% annual growth rate in the chiropractor job market, indicating a stable outlook for career opportunities across the state. With a total employment figure of 663 chiropractors, cities like Franklin ($91,418), Murfreesboro ($90,892), Memphis ($86,036), and Chattanooga ($82,047) are also promising locations for employment, further reflecting the diverse salary landscape throughout Tennessee. The demand for chiropractic services continues to drive this positive trend.
Tennessee Chiropractor Salary Range
Overall salary range in Tennessee: $40,724 (lowest entry-level) to $141,697 (highest top earner)
Tennessee vs National Average
Tennessee chiropractors earn 2.05% more than the national median (+$1,662/year difference).
Tennessee Chiropractor Salary Distribution (2026)
Chiropractor salaries in Tennessee range from $53,185 (entry-level, 10th percentile) to $118,140 (top earners, 90th percentile), with a median of $82,676. The Tennessee median is $1,662 above the US national median of $81,014. The average hourly rate is $39.75/hr. Approximately 663 chiropractors are employed across 30 cities.
2019 BLS Actual
$55,263
2025 BLS Actual
$80,825
2026 Current Est.
$82,676
2019–2027 Growth
+53.0%
Salary Trajectory for Chiropractors in Tennessee (2019–2027)
2019–2025: actual BLS OEWS data for this metro area. 2026+: CAGR 2.29% projection.
| Year | Annual Salary | Status |
|---|---|---|
| 2019 | $55,263 | Actual |
| 2020 | $53,157 | Actual |
| 2021 | $66,455 | Actual |
| 2022 | $53,527 | Actual |
| 2023 | $69,349 | Actual |
| 2024 | $73,996 | Actual |
| 2025 | $80,825 | Actual |
| 2026(current) | $82,676 | Estimated |
| 2027 | $84,569 | Projected |
Based on 7 years of BLS OEWS data for the Tennessee metropolitan area, the median chiropractor salary grew 46.3% from $55,263 (2019) to $80,825 (2025). At a 2.29% compound annual growth rate, salaries are projected to reach $84,569 by 2027 — a total increase of $29,306 (53.03%) from 2019.
Note: Historical values (2019–2025) are actual BLS OEWS figures for the Tennessee metropolitan area, sourced from annual Occupational Employment and Wage Statistics surveys. 2026–2026 figures are current estimates, and 2027 values are projections, calculated using a 2.29% CAGR derived from 7-year BLS historical data. Actual salaries may vary based on employer, experience, certifications, and local market conditions.
Top 5 Highest Paying Cities in Tennessee
Lowest Paying Cities in Tennessee
| City | Median Salary |
|---|---|
| Tullahoma | $68,714 |
| Sevierville | $70,214 |
| Maryville | $70,619 |
| Cookeville | $70,665 |
| La Vergne | $71,029 |
Best Value Cities for Chiropractors in Tennessee
When adjusted for local cost of living, these Tennessee cities offer the most purchasing power for chiropractors.
| City | Nominal Salary | CoL Index | Adjusted Salary |
|---|---|---|---|
| Franklin | $91,418 | 91.8 | $99,584 |
| Murfreesboro | $90,892 | 91.8 | $99,011 |
| Nashville | $92,532 | 96.338 | $96,049 |
| Memphis | $86,036 | 92.179 | $93,336 |
| Chattanooga | $82,047 | 91.464 | $89,704 |
Adjusted salary = nominal salary × (100 / CoL index). CoL index: 100 = national average. Lower index = lower cost of living.
Salary by Experience Level in Tennessee
| Experience Level | Estimated Annual |
|---|---|
| Entry Level (0-2 years) | $53,185 |
| Mid Career (3-7 years) | $82,676 |
| Experienced (7+ years) | $118,140 |
Estimates based on BLS percentile data averaged across Tennessee metro areas. Individual pay varies by employer, certifications, and specialization.
All 30 Cities in Tennessee
| # | City | Median Salary |
|---|---|---|
| 1 | Nashville | $92,532 |
| 2 | Franklin | $91,418 |
| 3 | Murfreesboro | $90,892 |
| 4 | Memphis | $86,036 |
| 5 | Chattanooga | $82,047 |
| 6 | Knoxville | $75,580 |
| 7 | Smyrna | $75,173 |
| 8 | Jackson | $75,032 |
| 9 | Johnson City | $74,908 |
| 10 | Bartlett | $74,796 |
| 11 | Collierville | $74,538 |
| 12 | Spring Hill | $73,966 |
| 13 | Kingsport | $73,930 |
| 14 | Morristown | $73,644 |
| 15 | Clarksville | $73,550 |
| 16 | Lebanon | $72,974 |
| 17 | Oak Ridge | $72,968 |
| 18 | Cleveland | $72,639 |
| 19 | Columbia | $72,478 |
| 20 | Germantown | $72,386 |
| 21 | Hendersonville | $72,240 |
| 22 | Gallatin | $72,113 |
| 23 | Brentwood | $71,739 |
| 24 | Shelbyville | $71,181 |
| 25 | Mount Juliet | $71,178 |
| 26 | La Vergne | $71,029 |
| 27 | Cookeville | $70,665 |
| 28 | Maryville | $70,619 |
| 29 | Sevierville | $70,214 |
| 30 | Tullahoma | $68,714 |
More Tennessee Salary Data
Senior / Experienced
Top earner salaries for experienced chiropractors.
Explore More Chiropractor Salary Data
Frequently Asked Questions
How much do chiropractors make in Tennessee in 2026?
What is the highest paying city for chiropractors in Tennessee?
How does Tennessee chiropractor pay compare to the national average?
What is the entry-level chiropractor salary in Tennessee?
How many chiropractors are employed in Tennessee?
Which Tennessee city offers the best value for chiropractors?
Written by Maria Gonzalez, D.C.
Career Analyst
Maria has 10 years of experience as a chiropractor. She specializes in sports injuries and practices in a private clinic. Maria also conducts workshops for community health education.
Methodology & Data Source
Statewide salary figures on this page are 2026 projections based on the Bureau of Labor Statistics Occupational Employment and Wage Statistics (OEWS) survey, May 2026 release. A 2.29% compound annual growth rate (CAGR), derived from 6-year national BLS wage trends, was applied to each metro area's reported salary to estimate current 2026 chiropractor compensation across Tennessee. State averages are employment-weighted across 30 metro areas — larger metro areas with more chiropractorscontribute proportionally more to the average, producing figures that better reflect typical compensation. Individual pay varies by city, employer, certifications, and experience.
Data Sources & Methodology
Source: BLS, OEWS, 7-year dataset (–). Per-city data from annual BLS metropolitan area surveys.
2026 figures are projected from 2025 BLS data using a compound annual growth rate (CAGR) of 2.29%, derived from historical BLS wage trends for chiropractors (SOC 29-1011).
Compiled and verified by Maria Gonzalez, D.C., a licensed chiropractor with 10+ years of clinical experience. · View source data at BLS.gov