Chiropractor Salary in Bennington, VT: $80,348 (2026)
Quick Answer:A full-time chiropractor in Bennington, VT earns a median $80,348/year (≈ $38.62/hour) in nominal terms for 2026 — projected from BLS OEWS 2025 (SOC 29-1011). Once you factor in Bennington's price level (4% above national, BEA RPP 103.5), that paycheck buys what $77,631 would nationally. Nominal pay sits 4.2% below the Vermont state average.
Based on BLS state-level estimates · View source
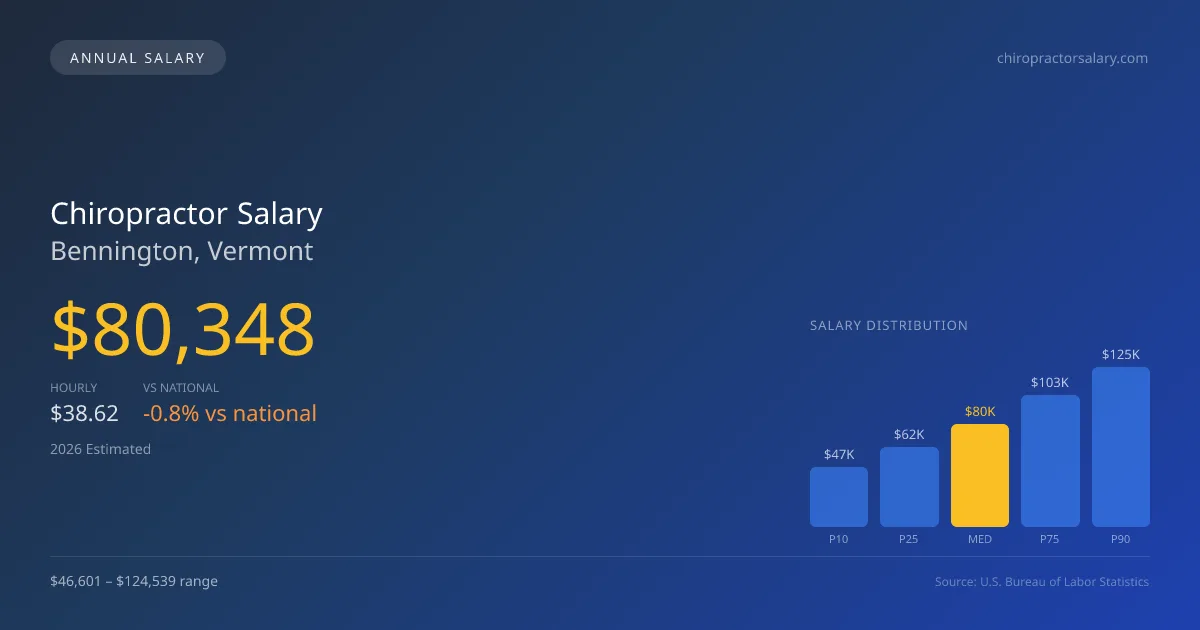
Chiropractors in Bennington, Vermont, earn a median annual salary of $80,348 in 2026, slightly below the national median of $81,014. The compensation for this profession varies considerably, with a salary range from $46,601 at the 10th percentile to $124,539 at the 90th percentile. These figures stem from regional price adjustments and estimates based on 2025 BLS data, indicating the local dynamics of chiropractor pay in Bennington VT. The shift in compensation models, particularly the growing trend toward subscription services and cash-pay options, has affected overall salaries and payment structures in the area, thereby influencing job opportunities in the market.
About the Bennington Market
Salary estimated from Vermont average ($78,000) adjusted for local cost of living.
Salary Breakdown
| Percentile | Annual | Hourly |
|---|---|---|
| Entry Level (P10) | $46,601 | $22.40 |
| Lower Range (P25) | $61,905 | $29.77 |
| Median (P50)(typical) | $80,348 | $38.62 |
| Upper Range (P75) | $102,845 | $49.45 |
| Top Earners (P90) | $124,539 | $59.87 |
Median Salary Position
0.82% below the national average
2026 Salary Percentile Distribution in Bennington
In Bennington, VT, the chiropractor salary spread from the 10th to 90th percentile is $77,938 (2026 est.). At $80,348, the local median is 0.82% below the national median of $81,014.
Salary Calculator
At 40 hours/week in Bennington: You'd be in the lower-middle range
How Bennington Chiropractor Pay Compares
Bennington median: $80,348/year (2026)
| Compared To | Median Salary | Bennington Pays |
|---|---|---|
| Vermont Average | $83,870 | -4.20% less |
| National Average | $81,014 | -0.82% less |
Chiropractors in Bennington, VT earn a median of $80,348 per year (2026 est.), which is 0.82% lower than the national median of $81,014 and 4.20% below the Vermont state average of $83,870.
Cost-of-Living Adjusted Salary
Bennington has a cost of living 3.50% above the national average.
Adjusted salary = nominal × (100 / CoL index). CoL index: 100 = national average.
Bennington, VT has a cost-of-living index of 103.5 (above the national average of 100). While the nominal salary of $80,348 is competitive, the higher cost of living reduces purchasing power to an effective $77,631 — a 3.38% reduction.
Compare Purchasing Power
Select a city to see how your salary compares after cost of living
Select a city above to compare purchasing power
2019 BLS Actual
$69,762
2025 BLS Actual
$78,549
2026 Current Est.
$80,348
2019–2027 Growth
+17.8%
Salary Trajectory for Chiropractors in Bennington (2019–2027)
2019–2025: actual BLS OEWS data for this metro area. 2026+: CAGR 2.29% projection.
| Year | Annual Salary | Status |
|---|---|---|
| 2019 | $69,762 | Actual |
| 2020 | $70,139 | Actual |
| 2021 | $74,384 | Actual |
| 2022 | $74,760 | Actual |
| 2023 | $75,901 | Actual |
| 2024 | $77,358 | Actual |
| 2025 | $78,549 | Actual |
| 2026(current) | $80,348 | Estimated |
| 2027 | $82,188 | Projected |
Based on 7 years of BLS OEWS data for the Bennington metropolitan area, the median chiropractor salary grew 12.6% from $69,762 (2019) to $78,549 (2025). At a 2.29% compound annual growth rate, salaries are projected to reach $82,188 by 2027 — a total increase of $12,426 (17.81%) from 2019.
Note: Historical values (2019–2025) are actual BLS OEWS figures for the Bennington metropolitan area, sourced from annual Occupational Employment and Wage Statistics surveys. 2026–2026 figures are current estimates, and 2027 values are projections, calculated using a 2.29% CAGR derived from 7-year BLS historical data. Actual salaries may vary based on employer, experience, certifications, and local market conditions.
Salary by Experience Level
| Experience | Estimated Salary Range |
|---|---|
| 0-2 years (New Graduate) | $46,601 – $61,905 |
| 3-5 years (Mid Career) | $61,905 – $80,348 |
| 5+ years (Experienced) | $80,348 – $102,845 |
| 10+ years (Top Earner) | $102,845 – $124,539 |
DC salary ranges estimated from BLS percentile data. Individual chiropractor compensation varies by employer, certifications, and specialization.
Chiropractor Job Market in Bennington
Currently, Bennington has a modest local job market for chiropractors, with only six practitioners employed. The area's cost of living index sits at 103.5, suggesting that while salaries may be competitive, the purchasing power takes a hit due to living expenses. Among local employers, solo private practices typically lead in compensation, benefiting from practice ownership equity. In contrast, multi-doctor clinics and franchises like The Joint Chiropractic offer varied pay structures based on their subscription or membership models. Factors contributing to disparities in chiropractor pay in Bennington include the mix of cash transactions versus insurance reimbursements and the potential for consulting income through corporate partnerships. To enhance earning potential in this landscape, chiropractors can consider adopting a hybrid practice model, emphasizing cash-pay options, and expanding services to include corporate wellness programs or affiliate relationships with local sports teams.
More salary data for Bennington, VT:
Frequently Asked Questions
How much do chiropractors make in Bennington, VT in 2026?
Is Bennington, VT a good place to work as a chiropractor?
Can chiropractors make $100K in Bennington?
What is the cost-of-living adjusted chiropractor salary in Bennington?
How much does a chiropractor make per hour in Bennington?
Related Pages
Compare Salaries
Career Resources
Nearby Cities in Vermont
Written by Maria Gonzalez, D.C.
Career Analyst
Maria has 10 years of experience as a chiropractor. She specializes in sports injuries and practices in a private clinic. Maria also conducts workshops for community health education.
Methodology & Data Source
Salary figures on this page are 2026 projections based on the Bureau of Labor Statistics Occupational Employment and Wage Statistics (OEWS) survey, May 2026 release. The BLS reported a median annual salary of $78,549 for chiropractorsin the Bennington metropolitan area. A 2.29% compound annual growth rate (CAGR), calculated from 6-year national BLS wage trends, was applied to project current 2026 compensation. Percentile ranges (P10–P90) represent the full salary distribution across experience levels and practice settings in this market.
Data Sources & Methodology
Salary data for Bennington is estimated from official BLS state-level occupational wage data (2025), adjusted for regional cost-of-living differences using BEA RPP (Regional Price Parities).
2026 figures are projected from 2025 BLS data using a compound annual growth rate (CAGR) of 2.29%, derived from historical BLS wage trends for chiropractors (SOC 29-1011).
Compiled and verified by Maria Gonzalez, D.C., a licensed chiropractor with 10+ years of clinical experience. · View source data at BLS.gov