Chiropractor Salary in Arlington, TX: $97,798 (2026)
Quick Answer:A full-time chiropractor in Arlington, TX earns a median $97,798/year (≈ $47.02/hour) in nominal terms for 2026 — projected from BLS OEWS 2025 (SOC 29-1011). Once you factor in Arlington's price level (4% below national, BEA RPP 96.0), that paycheck buys what $101,873 would nationally. Nominal pay sits 18.0% above the Texas state average.
Based on BLS state-level estimates · View source
In 2026, the expected chiropractor salary in Arlington, TX, is projected at $97,798, which significantly outpaces the national median of $81,014. This figure reflects the growing opportunities in the region’s chiropractic market, where salaries range from $56,723 at the 10th percentile to $151,588 at the 90th percentile. The local estimates, derived from the Bureau of Labor Statistics (BLS) and adjusted for regional price levels, indicate a strong earning potential for chiropractors in various practice settings. It’s important for aspiring chiropractors to consider their structural choices—whether to join a franchise, establish a solo practice, or join integrated medical facilities—as these decisions can greatly influence overall compensation and job satisfaction in Arlington.
About the Arlington Market
Salary estimated from Texas average ($85,000) adjusted for local cost of living.
Salary Breakdown
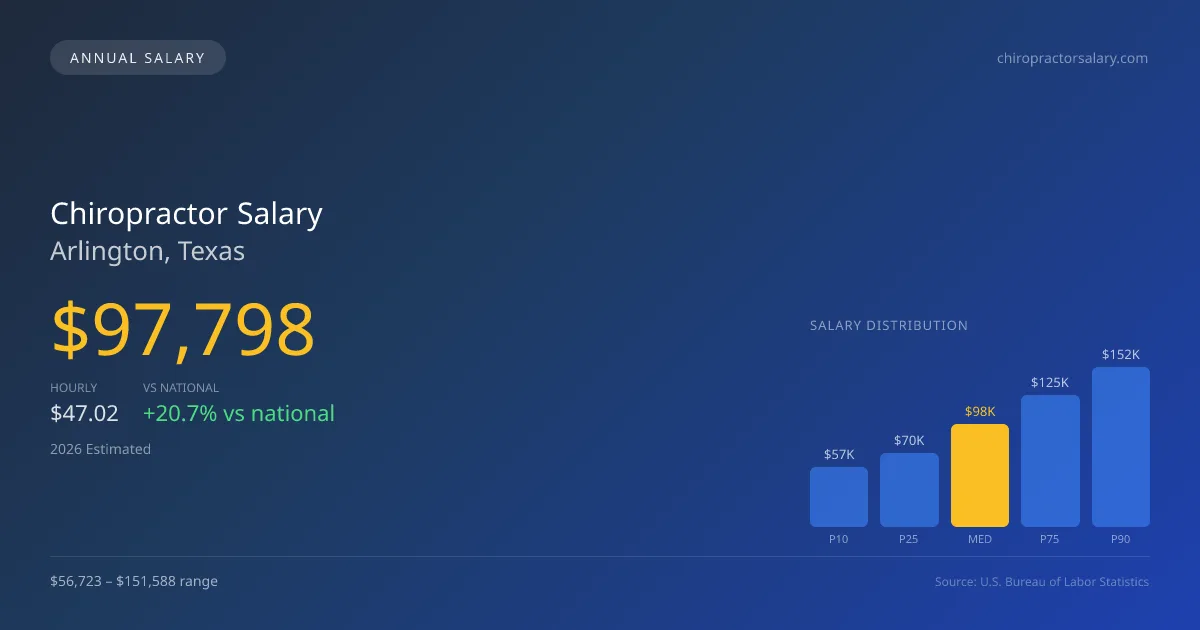
| Percentile | Annual | Hourly |
|---|---|---|
| Entry Level (P10) | $56,723 | $27.27 |
| Lower Range (P25) | $70,414 | $33.86 |
| Median (P50)(typical) | $97,798 | $47.02 |
| Upper Range (P75) | $125,183 | $60.19 |
| Top Earners (P90) | $151,588 | $72.88 |
Median Salary Position
20.72% above the national average
2026 Salary Percentile Distribution in Arlington
In Arlington, TX, the chiropractor salary spread from the 10th to 90th percentile is $94,865 (2026 est.). At $97,798, the local median is 20.72% above the national median of $81,014.
Salary Calculator
At 40 hours/week in Arlington: You'd be in the lower-middle range
How Arlington Chiropractor Pay Compares
Arlington median: $97,798/year (2026)
| Compared To | Median Salary | Arlington Pays |
|---|---|---|
| Texas Average | $82,880 | +18.00% more |
| National Average | $81,014 | +20.72% more |
Chiropractors in Arlington, TX earn a median of $97,798 per year (2026 est.), which is 20.72% higher than the national median of $81,014 and 18.00% above the Texas state average of $82,880.
Cost-of-Living Adjusted Salary
Arlington has a cost of living 4.00% below the national average, meaning your salary goes further here.
Adjusted salary = nominal × (100 / CoL index). CoL index: 100 = national average.
Arlington, TX has a cost-of-living index of 96 (below the national average of 100). A chiropractor earning $97,798 nominally has purchasing power equivalent to $101,873 in an average-cost city — an effective 4.17% boost.
Compare Purchasing Power
Select a city to see how your salary compares after cost of living
Select a city above to compare purchasing power
2019 BLS Actual
$84,913
2025 BLS Actual
$95,609
2026 Current Est.
$97,798
2019–2027 Growth
+17.8%
Salary Trajectory for Chiropractors in Arlington (2019–2027)
2019–2025: actual BLS OEWS data for this metro area. 2026+: CAGR 2.29% projection.
| Year | Annual Salary | Status |
|---|---|---|
| 2019 | $84,913 | Actual |
| 2020 | $85,372 | Actual |
| 2021 | $90,539 | Actual |
| 2022 | $90,998 | Actual |
| 2023 | $92,386 | Actual |
| 2024 | $83,949 | Actual |
| 2025 | $95,609 | Actual |
| 2026(current) | $97,798 | Estimated |
| 2027 | $100,038 | Projected |
Based on 7 years of BLS OEWS data for the Arlington metropolitan area, the median chiropractor salary grew 12.6% from $84,913 (2019) to $95,609 (2025). At a 2.29% compound annual growth rate, salaries are projected to reach $100,038 by 2027 — a total increase of $15,125 (17.81%) from 2019.
Note: Historical values (2019–2025) are actual BLS OEWS figures for the Arlington metropolitan area, sourced from annual Occupational Employment and Wage Statistics surveys. 2026–2026 figures are current estimates, and 2027 values are projections, calculated using a 2.29% CAGR derived from 7-year BLS historical data. Actual salaries may vary based on employer, experience, certifications, and local market conditions.
Salary by Experience Level
| Experience | Estimated Salary Range |
|---|---|
| 0-2 years (New Graduate) | $56,723 – $70,414 |
| 3-5 years (Mid Career) | $70,414 – $97,798 |
| 5+ years (Experienced) | $97,798 – $125,183 |
| 10+ years (Top Earner) | $125,183 – $151,588 |
DC salary ranges estimated from BLS percentile data. Individual chiropractor compensation varies by employer, certifications, and specialization.
Chiropractor Job Market in Arlington
With 83 chiropractors currently employed in Arlington, the job market remains competitive yet promising. The cost of living index stands at 96, suggesting that housing and general expenses are below the national average, providing an extended purchasing power for professionals. Among various employers, multi-doctor clinics and integrated health facilities typically offer higher salaries compared to traditional solo practices. Factors contributing to the income disparities include ownership equity, patient referral networks from integrated practices, and revenue-sharing models utilized by franchisee operations like The Joint Chiropractic. Those aspiring to maximize their chiropractor pay in Arlington, TX, should consider diversifying their income streams through offerings like sports consulting or cash-based services. Adapting to trends such as a membership pricing model can also enhance earnings, allowing for more stable revenue sources while developing a loyal patient base.
More salary data for Arlington, TX:
Frequently Asked Questions
How much do chiropractors make in Arlington, TX in 2026?
Is Arlington, TX a good place to work as a chiropractor?
Can chiropractors make $100K in Arlington?
What is the cost-of-living adjusted chiropractor salary in Arlington?
How much does a chiropractor make per hour in Arlington?
Related Pages
Compare Salaries
Career Resources
Nearby Cities in Texas
Written by Maria Gonzalez, D.C.
Career Analyst
Maria has 10 years of experience as a chiropractor. She specializes in sports injuries and practices in a private clinic. Maria also conducts workshops for community health education.
Methodology & Data Source
Salary figures on this page are 2026 projections based on the Bureau of Labor Statistics Occupational Employment and Wage Statistics (OEWS) survey, May 2026 release. The BLS reported a median annual salary of $95,609 for chiropractorsin the Arlington metropolitan area. A 2.29% compound annual growth rate (CAGR), calculated from 6-year national BLS wage trends, was applied to project current 2026 compensation. Percentile ranges (P10–P90) represent the full salary distribution across experience levels and practice settings in this market.
Data Sources & Methodology
Salary data for Arlington is estimated from official BLS state-level occupational wage data (2025), adjusted for regional cost-of-living differences using BEA RPP (Regional Price Parities).
2026 figures are projected from 2025 BLS data using a compound annual growth rate (CAGR) of 2.29%, derived from historical BLS wage trends for chiropractors (SOC 29-1011).
Compiled and verified by Maria Gonzalez, D.C., a licensed chiropractor with 10+ years of clinical experience. · View source data at BLS.gov